I have deployed my cool wf-app into production several weeks ago. Now users are complaining about errors occuring on the screen. A first investigation into the logs revealed that there seems to be a connection problem with the elastic search server. I'm using the bundled elastic search server as it is shipped with the Axon.ivy Engine (7.3). Whats the issue here?

Caused by: java.net.SocketTimeoutException: Read timed out

[errorId=16AE46D591AAA1BE, request=HTTP POST Start Processes/DepartmentHead.mod/163BB87520D405CF-f3(493708.480005.45511.1), session=524 (a.f@m.ch), task=480005, application=301, requestId=34869, executionContext=524 (a.f@m.ch), pmv=GMAA$hr_pbm_0001_pf$1, client=10.208.68.15, hd=com.axonivy.hrwf.pbm0001.components.ZurueckweisenKommentar, processElement=163BB87520D405CF-f17]
    Caused by: ch.ivyteam.ivy.business.data.store.search.internal.elasticsearch.ElasticsearchException: Cannot reach Elasticsearch server
        at ch.ivyteam.ivy.business.data.store.search.internal.elasticsearch.JestOperation.tryToExecute(JestOperation.java:51)
        at ch.ivyteam.ivy.business.data.store.search.internal.elasticsearch.JestOperation.execute(JestOperation.java:36)
        at ch.ivyteam.ivy.business.data.store.search.internal.elasticsearch.JestIndexSynchronizer.execute(JestIndexSynchronizer.java:151)
        at ch.ivyteam.ivy.business.data.store.search.internal.elasticsearch.JestIndexSynchronizer.updateDocument(JestIndexSynchronizer.java:50)
        at ch.ivyteam.ivy.business.data.store.search.internal.ElasticBusinessDataSearchIndex.update(ElasticBusinessDataSearchIndex.java:33)
        at ch.ivyteam.ivy.business.data.store.internal.ElasticSystemDbPersistence.lambda$2(ElasticSystemDbPersistence.java:140)
        ... 174 more
    Caused by: java.net.SocketTimeoutException: Read timed out
        at java.net.SocketInputStream.socketRead0(Native Method)
        at java.net.SocketInputStream.socketRead(SocketInputStream.java:116)
        at java.net.SocketInputStream.read(SocketInputStream.java:171)
        at java.net.SocketInputStream.read(SocketInputStream.java:141)
        at org.apache.http.impl.io.SessionInputBufferImpl.streamRead(SessionInputBufferImpl.java:137) ...
        at org.apache.http.impl.conn.DefaultHttpResponseParser.parseHead(DefaultHttpResponseParser.java:56)
        at org.apache.http.impl.io.AbstractMessageParser.parse(AbstractMessageParser.java:259)
        at org.apache.http.impl.DefaultBHttpClientConnection.receiveResponseHeader(DefaultBHttpClientConnection.java:163)
        at org.apache.http.impl.conn.CPoolProxy.receiveResponseHeader(CPoolProxy.java:165)
        at org.apache.http.protocol.HttpRequestExecutor.doReceiveResponse(HttpRequestExecutor.java:273)...
        at org.apache.http.impl.client.CloseableHttpClient.execute(CloseableHttpClient.java:108)
        at io.searchbox.client.http.JestHttpClient.executeRequest(JestHttpClient.java:133) ...
        at ch.ivyteam.ivy.business.data.store.search.internal.elasticsearch.JestOperation.tryToExecute(JestOperation.java:45)
        ... 183 more

asked 27.05.2019 at 03:17

SupportIvyTeam's gravatar image

SupportIvyTeam ♦♦
1.4k102118122
accept rate: 77%

edited 27.05.2019 at 04:47

Reguel%20Wermelinger's gravatar image

Reguel Werme... ♦♦
9.4k31958


Configure Timeouts

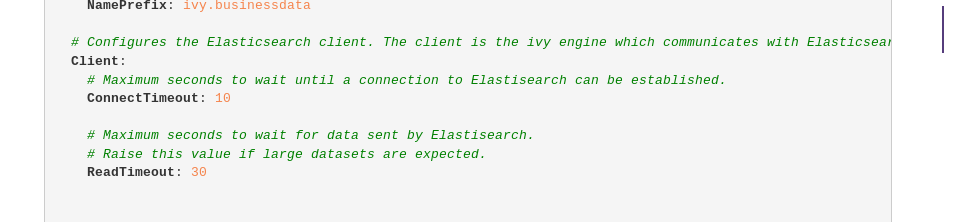
Theoretically there could be a read timeout if lots of data is being transported between ElasticSearch and the Axon.ivy Engine. You can raise the timeout times in the ivy.yaml and check if that solves the connectivity problem: https://developer.axonivy.com/doc/latest/EngineGuideHtml/configuration.html#ref_Elasticsearch alt text

Check Index Health

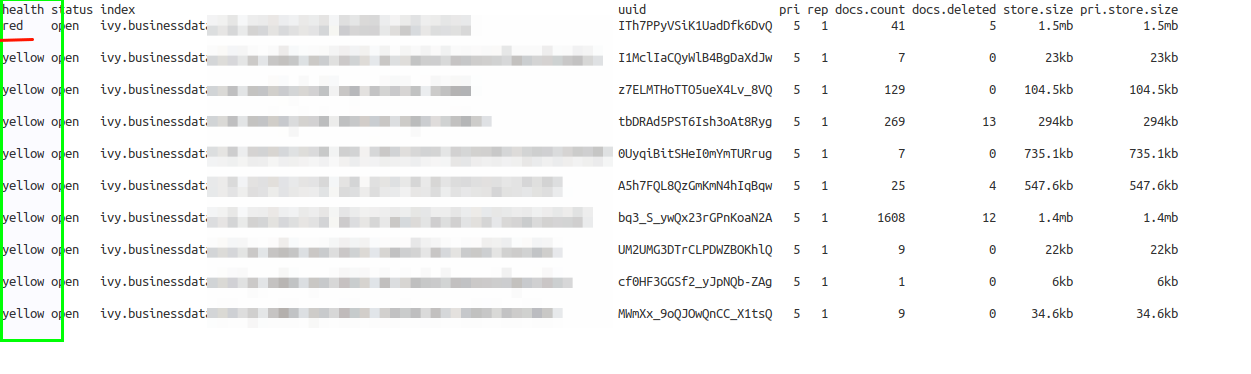
Elastic Search has a REST API. Therefore, one can easily list all indexes and check its health state. If the health of an index is in state RED, the Axon.ivy Engine will be unable to communicate with it.

On the Engine host you can list indexes via: http://localhost:19200/_cat/indices?v redIndexExample

Elastic Logs

Once you are aware that an Index is RED, you can analyze the elastic search logs. They can be found in the file system engineDir/elasticsearch/logs. Scan these logs for messages that relate to the red index. This can be a tricky task when the interesting logs are splitted into multiple files. I like to do such analysis via the well known grep binary from the unix stack. grep -C 10 ivy.businessdata-myIndexName *.log

Here is a sample which exposes the lack of diskspace as the cause of the problem: alt text

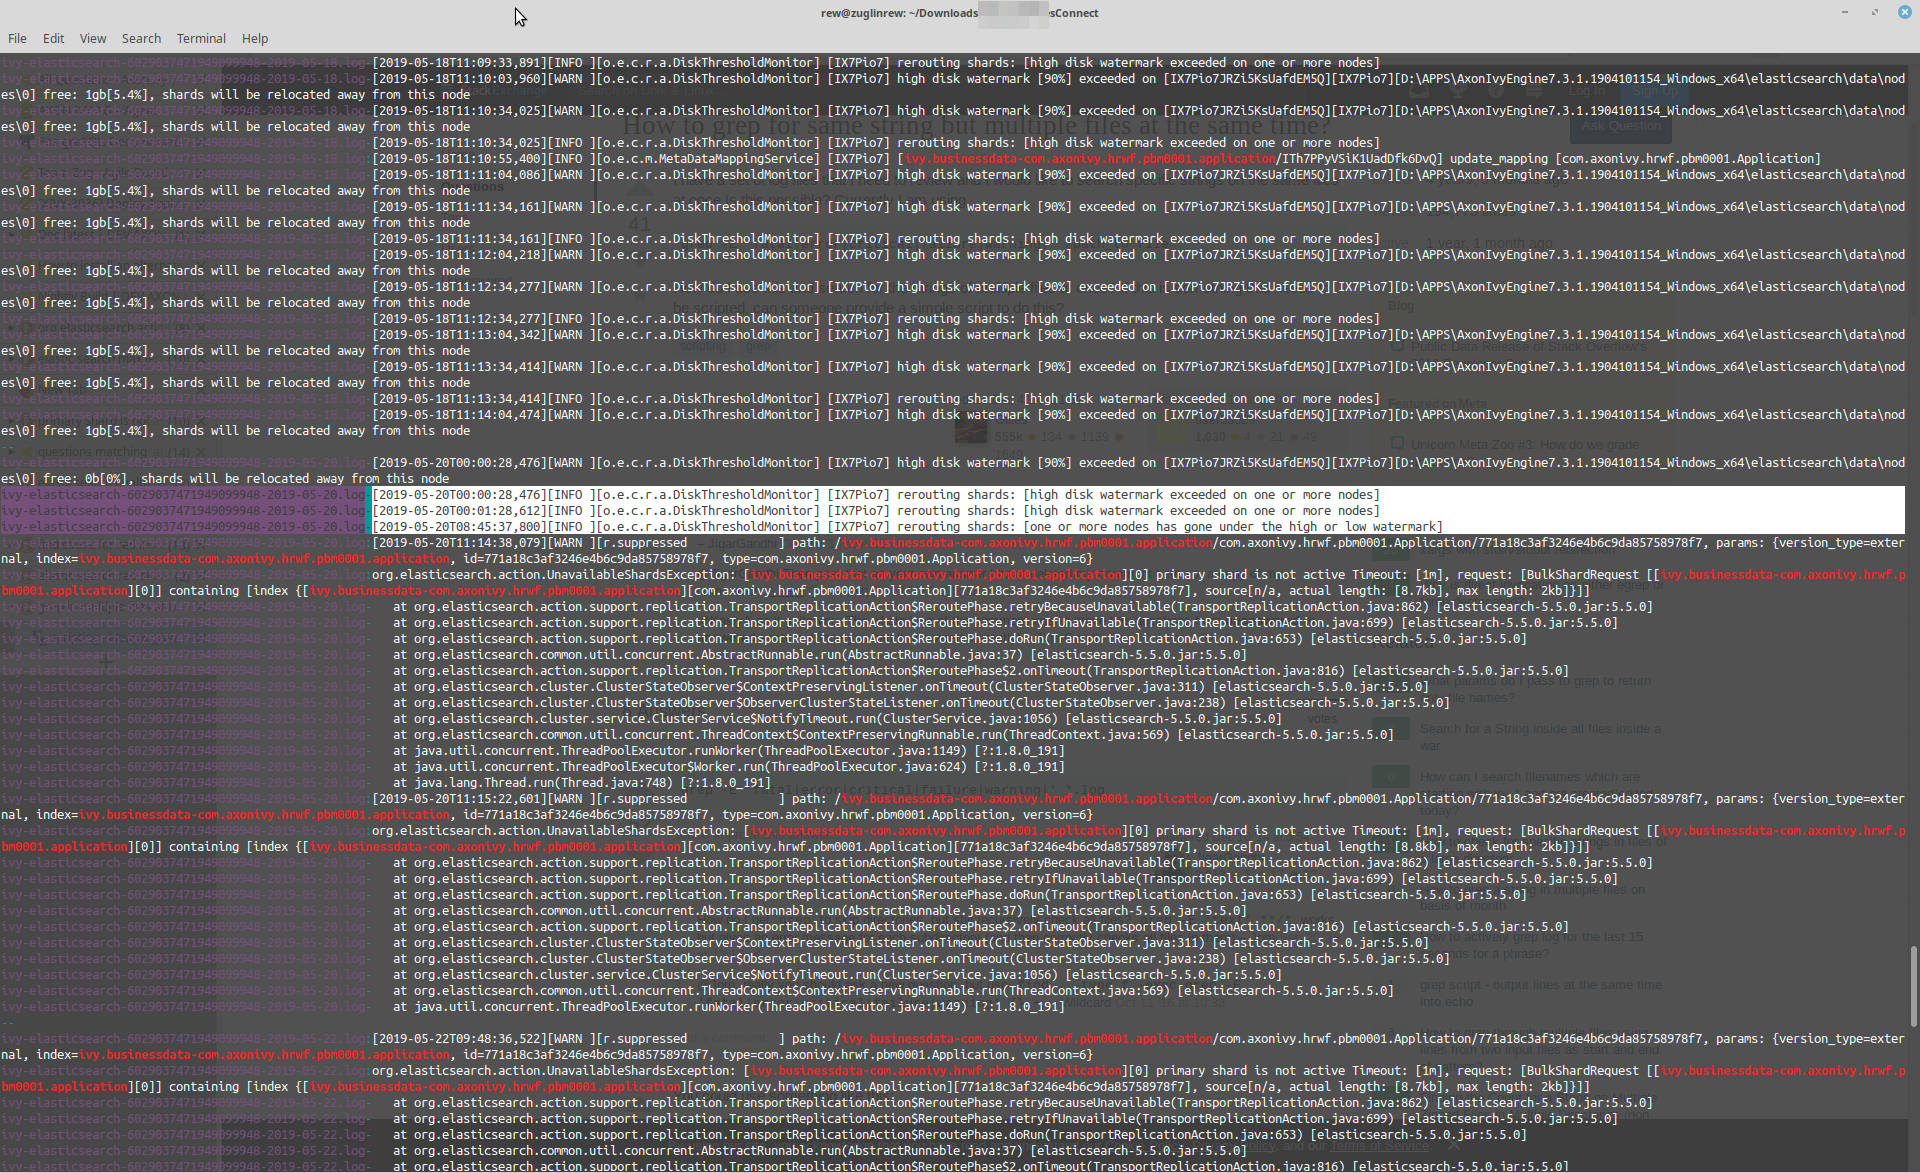
In the shown case the latest elastic search logs contain org.elasticsearch.action.UnavailableShardsExceptions whenever the engine tries to write into that RED index. However, walking back in the logs clearly shows that elasticsearch index just ran out of space before.

[2019-05-23T13:22:42,633][WARN ][r.suppressed             ] path: /ivy.businessdata-com.axonivy.hrwf.pbm0001.application/com.axonivy.hrwf.pbm0001.Application/771a18c3af3246e4b6c9da85758978f7, params: {version_type=external, index=ivy.businessdata-com.axonivy.hrwf.pbm0001.application, id=771a18c3af3246e4b6c9da85758978f7, type=com.axonivy.hrwf.pbm0001.Application, version=6}
org.elasticsearch.action.UnavailableShardsException: [ivy.businessdata-com.axonivy.hrwf.pbm0001.application][0] primary shard is not active Timeout: [1m], request: [BulkShardRequest [[ivy.businessdata-com.axonivy.hrwf.pbm0001.application][0]] containing [index {[ivy.businessdata-com.axonivy.hrwf.pbm0001.application][com.axonivy.hrwf.pbm0001.Application][771a18c3af3246e4b6c9da85758978f7], source[n/a, actual length: [8.7kb], max length: 2kb]}]]
    at org.elasticsearch.action.support.replication.TransportReplicationAction$ReroutePhase.retryBecauseUnavailable(TransportReplicationAction.java:862) [elasticsearch-5.5.0.jar:5.5.0]
    at org.elasticsearch.action.support.replication.TransportReplicationAction$ReroutePhase.retryIfUnavailable(TransportReplicationAction.java:699) [elasticsearch-5.5.0.jar:5.5.0]
    at org.elasticsearch.action.support.replication.TransportReplicationAction$ReroutePhase.doRun(TransportReplicationAction.java:653) [elasticsearch-5.5.0.jar:5.5.0]
    at org.elasticsearch.common.util.concurrent.AbstractRunnable.run(AbstractRunnable.java:37) [elasticsearch-5.5.0.jar:5.5.0]
    at org.elasticsearch.action.support.replication.TransportReplicationAction$ReroutePhase$2.onTimeout(TransportReplicationAction.java:816) [elasticsearch-5.5.0.jar:5.5.0]
    at org.elasticsearch.cluster.ClusterStateObserver$ContextPreservingListener.onTimeout(ClusterStateObserver.java:311) [elasticsearch-5.5.0.jar:5.5.0]
    at org.elasticsearch.cluster.ClusterStateObserver$ObserverClusterStateListener.onTimeout(ClusterStateObserver.java:238) [elasticsearch-5.5.0.jar:5.5.0]
    at org.elasticsearch.cluster.service.ClusterService$NotifyTimeout.run(ClusterService.java:1056) [elasticsearch-5.5.0.jar:5.5.0]
    at org.elasticsearch.common.util.concurrent.ThreadContext$ContextPreservingRunnable.run(ThreadContext.java:569) [elasticsearch-5.5.0.jar:5.5.0]
    at java.util.concurrent.ThreadPoolExecutor.runWorker(ThreadPoolExecutor.java:1149) [?:1.8.0_191]
    at java.util.concurrent.ThreadPoolExecutor$Worker.run(ThreadPoolExecutor.java:624) [?:1.8.0_191]
    at java.lang.Thread.run(Thread.java:748) [?:1.8.0_191]
link

answered 27.05.2019 at 03:21

Reguel%20Wermelinger's gravatar image

Reguel Werme... ♦♦
9.4k31958
accept rate: 70%

edited 27.05.2019 at 04:47

Your answer
toggle preview

Follow this question

By Email:

Once you sign in you will be able to subscribe for any updates here

By RSS:

Answers

Answers and Comments

Markdown Basics

  • *italic* or _italic_
  • **bold** or __bold__
  • link:[text](http://url.com/ "Title")
  • image?![alt text](/path/img.jpg "Title")
  • numbered list: 1. Foo 2. Bar
  • to add a line break simply add two spaces to where you would like the new line to be.
  • basic HTML tags are also supported

Tags:

×22
×17

Asked: 27.05.2019 at 03:17

Seen: 4,642 times

Last updated: 27.05.2019 at 04:47